
The following is a selection of supply planning projects that are typically out of scope for many ERP systems. These range in complexity from simple data analytics to the deployment of advanced planning optimisation systems:
The goal is to increase customer service with reduced inventory. An optimal safety stock policy can be calculated by the application of statistics and probability theory. Inputs include:
We also implement a process to review the recommended safety stock level of the model versus demonstrated performance. The process can be integrated with the ERP system to enable safety stock levels to be reviewed routinely without repeating time consuming analysis.
The objective of this project was to improve the ability of the production scheduling team to optimise the schedule in a large complex manufacturing plant. Plant constraints and changeover considerations were all held in many peoples heads. The schedule had to be reviewed by approximately 8 people from different departments each week to get a view on schedule feasibility and optimality. Each department had competing objectives requiring a lot of subjective compromise. Even with the high degree of effort applied to review the schedule there were still instances where unknown infeasibilities in the schedule were found out the hard way.
The solution was to build a detailed factory model. The model comprised 145 resources and an attribute based change over matrix was applied to each for both time and cost on each resource. This enabled all the master data required to be broken into logical and manageable blocks.
A graphical schedule board was developed to enable the scheduler to drag and drop production runs with the impact of any scheduling decisions calculated and presented real time. Information available to the scheduler was as follows:
The last step was to apply a simulated annealing optimisation technique to the model enabling millions of different schedules to be costed and analysed.
A system was built which integrated with the current MRP. Reporting included days of cover before and after each planned purchase and projected inventory value. The model contained logic around when stock held at other locations should be considered. Projected age at consumption was calculated for every planned purchase to manage shelf life. This enabled exception based reporting and application of the 80/20 rule so that the material schedulers attention was directed to the 20% of items that made up 80% of the inventory value. Planned purchases that were within rules were able to be automatically converted to purchase orders without the need for manual review. Generation of the constraints report was also automated.
Most ERP systems don't provide a bottom up inventory forecast. The affect of lead times and offsets mean that it makes no sense to sum the projected inventory for each component as per the ERP system. Typically:
To accurately forecast inventory we apply a model that integrates with the ERP system and projects inventory at a SKU level taking into account that consumption of materials and generation of manufactured items is not discrete but continuous over the forecast length of production. Robustly projecting inventory is a key component of the supply step in an Integrated Business Management (IBM) process or if you are storage constrained. Note, that to forecast inventory you also need a mechanism to convert the unconstrained MPS to a supply plan that considers plant capacity, labour crewing patterns and material availability.
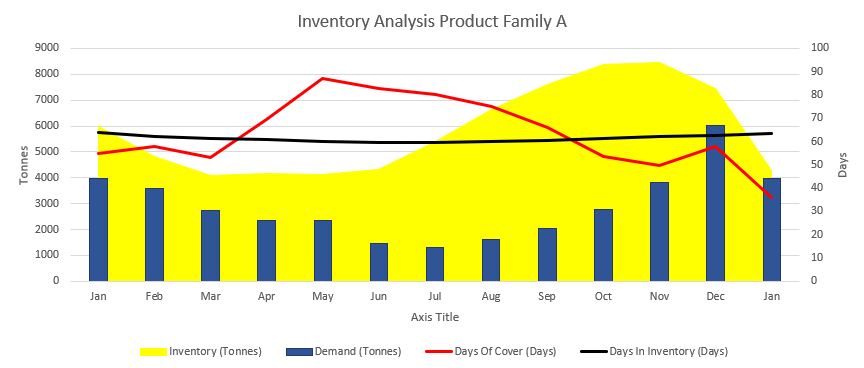
We make the analysis of inventory levels routine and improve visibility of days of cover both at a product family and SKU level. This information can be used as an input into the Integrated Business Management process. Many ERP systems do not calculate days of cover. Others divide stock on hand by average demand per day over a fixed constant horizon which doesn't work very well as soon as demand is not constant.
Planning distribution of finished goods from a production facility to multiple distribution centres isn't always as easy as it could be.
Your ERP system will contain information on stock on hand, scheduled production, and demand at the DC's. However, working out how many shipping containers to book, allocating constrained supply across them, and projecting customer service risk at the end points of your distribution network is often a time consuming process, manually undertaken on spreadsheets. The result of a manual process is unlikely to be optimal for all but the very simplest distribution networks.
We have developed a system which integrates with data from the ERP system. This applies the shipping schedule to formulate a mixed integer program to determine the optimal distribution plan based on the current production schedule. The output of the model includes projected days of cover before and after arrival of each vessel at the DC. This enables the production scheduler to identify the severity of any supply risks as a consequence of their scheduling decisions. For example, the impact of a production run missing a vessel cut off by mere hours may be small or large depending on a number of factors which usually are not properly represented in the typical ERP system or available to the scheduler in the right format. Using our model planning distribution becomes an automated process and provides the right information to the right people at the right time.
We believe it is important to ensure that your planning master data properly reflects demonstrated plant performance. You don't want your capacity plans to suffer from garbage in garbage out. You also don't want to lose sight of your continuous improvement opportunities.
The recommendation is to implement a system around two key metrics:Converting the unconstrained supply time from your ERP system to one that the cost to supply while accounting for your supply constraints requires the application of a mathematical model of your plant. It is likely that you will need to consider:
There are a number of options available from load levelling heuristics to liner and mixed integer programming.
We have experience in deploying both in-house solutions and commercially available advanced planning systems that come with their own inbuilt optimisation engine.